In the main area, the available information is displayed depending on the tab selected in the Information area.
The view for the characteristic maps and curves provides information about the hydraulic properties of the selected pump. The area for viewing the pump performance curve is the most functionally comprehensive tab in the display area. In addition to the diagram, there are the Optimize and Curve Points areas, where adjustments to operating points can be made and additional information and values can be displayed.
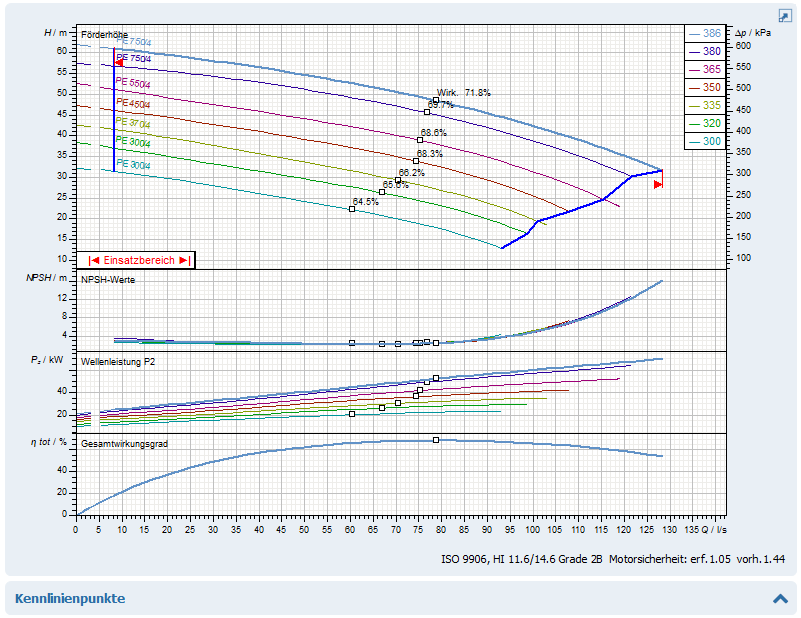
The diagram displays the hydraulic data of the selected pump in the currently used configuration.
To change this display, several menus are available above the diagram.
|
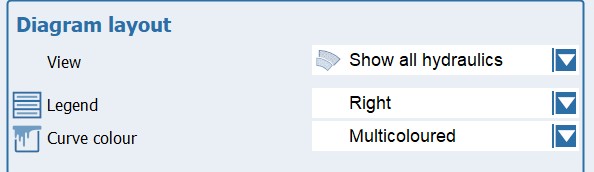
This menu is divided into two sections. In the upper section, "All Products," you can choose between comparative views for all pumps in the list.
 | Show all hydraulics: |
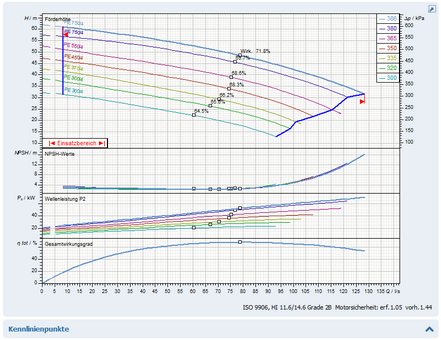
This option displays all performance map ranges of the pumps in the list in the Q-H diagram. The currently selected pump is highlighted.
|
| Selected performance curve of each hydraulic system: |
This diagram provides an overview of the maximum performance curves for all hydraulic systems of the pumps listed. All available diagram sections are displayed.
|
| Preview individual performance curves: |
This display corresponds to the Selected performance curves of each hydraulic system option, but only the Q-H diagram is shown.
|
In the lower area Selected Product you can choose between different representations for the currently selected pump.
| Show selected hydraulics: |
This diagram shows the complete hydraulic system of the selected pump with all associated maps. The currently active map is highlighted, while the other maps are grayed out.
|
 Show duty chart Show duty chart
If you select this setting, the currently active map is displayed.
|
| Display max. / sel. / min. characteristic curve: |
This option displays the maximum, currently active and minimum characteristic curves of the current map in the diagram.
|
This option limits the view to the currently active performance curve.
|
| Show multiple speed curves |
This option displays the speed map.
|
|
|
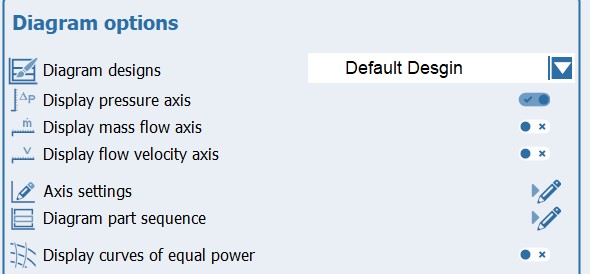
This menu contains functions for displaying diagram components. This menu is also available as a popup when the right mouse button is pressed while the mouse pointer is in the diagram.
The menu is divided into different sections.
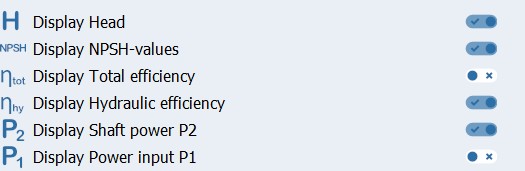
In the upper section, you can specify which of the diagram sections available for hydraulics should be displayed or hidden.
The display of the pressure axis, mass flow axis, and flow velocity can then be activated or deactivated by clicking.
The following two menu items relate to the display of the legend and the color representation of the performance curves.
This submenu allows you to decide whether the legend for the characteristic curve labels should be displayed in the diagram. If the legend is enabled, you can also specify its position.
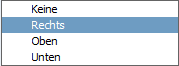
If the legend is not displayed (None), the characteristic curves are each provided with a label.
|
This submenu determines whether the characteristic curves are displayed in color or in black and white contour.
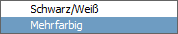
When using a multi-color display, it is important whether the legend is displayed or not. With a legend, each curve in the map is assigned its own color. Without a legend, only the active curve is highlighted, while the other curves are displayed in gray.
|
The following option activates the possibility to evaluate points of the active characteristic curve.
| Display curve point |
If this option is enabled, values of the active characteristic curve can be displayed. Blue markers become active on the characteristic curves and move with the position of the mouse pointer. When you click the left mouse button, these points snap to the current mouse position, and an information window appears with the valid values for the point.

When you press the left mouse button again, the point detaches, follows the mouse movement again and the information window disappears.
|
In the lower area, you have the option to display various additional elements in the diagram.

|
Depending on the data source, not all functions are always available. If options are not available, the corresponding entries in the menus are grayed out and therefore cannot be activated.
|
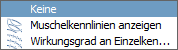
| Shell curves |
To display the efficiency in the Q-H diagram, you have the option of displaying shell characteristics or the efficiencies on the individual characteristics.
|
| Show curves of equal power: |
This option displays additional curves in the Q-H diagram that represent specific power values. This allows you to estimate the required power for specific points in the map.
|
This option displays an additional scale for the operating pressure on the right side of the Q-H diagram. This display takes the properties of the pumped medium into account.
|
| Display mass flow axis |
If you activate this option, an additional X-axis for the mass flow will be displayed.
|
|
|
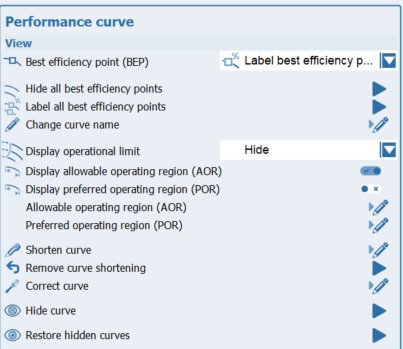
In this menu, you can configure settings related to the display of the individual performance curves. It is also divided into several sections.
The functions in the upper area relate to the physical properties of the performance curve.
| Hide curve |
This function allows you to hide the currently active performance curve. If this option is used, the next smaller performance curve is activated. Multiple performance curves can be hidden one after the other.
|
| Restore hidden curves |
This option allows you to display all previously hidden characteristic curves again. This option is only available if performance curves were previously hidden.
|
This submenu defines the display and labeling for the design points.
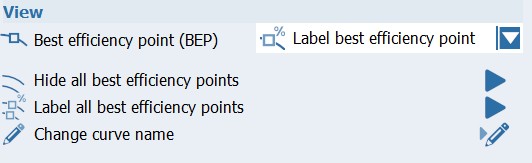
The upper section contains the options for hiding, displaying, and labeling the design point of the active performance curve. The lower section contains the corresponding options for all performance curves of the active map.
|
This function allows you to change the currently used characteristic curve name. This process is temporary, meaning it only applies to the current project. The original name is retained in the database and will be available the next time you select a characteristic curve.
|
The next section contains functions related to the display of application parameters.
| Draw motor power rating limitation |
When this option is enabled, the Q-H diagram displays the performance curves as solid lines only up to the extent permitted by the power of the currently selected motor. Areas above this limit are displayed as dashed curves.
|
| Display operational limit |
If this option is enabled, the minimum permissible flow rate is plotted for the entire performance map. The operating limit for a performance map is determined from the minimum values of the operating range of the individual perforamance curves. This limit is represented by a blue line.
|
| Shorten curve |
This function opens a dialog box in which you can change the display area of the performance curves.
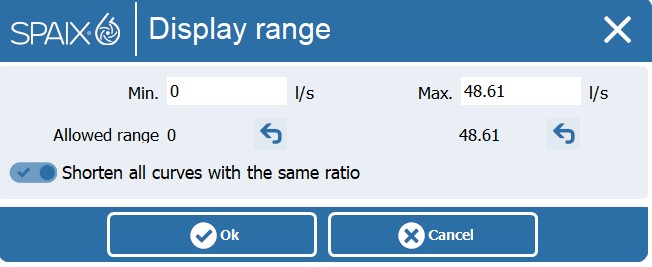
The Min. and Max. fields allow you to specify the limits for the new display. These limits must not be lower or higher than the allowed range displayed below the edit fields.
The buttons  can be used to undo the entry and restore the original state of the respective limit. can be used to undo the entry and restore the original state of the respective limit.
If you select the Shorten all curves by the same ratio option, this action will be applied to all curves in the map.
|
| Remove curve shortening |
This function restores the original state of the map.
|
The last function allows changes to be made to the operating range of the characteristic curve.
| Display application range |
This option enables the display of the operating range. This is represented by two red markers in the Q-H diagram.
|
| Edit application range |
This function opens a dialog box in which a new application area for the performance curve can be defined.
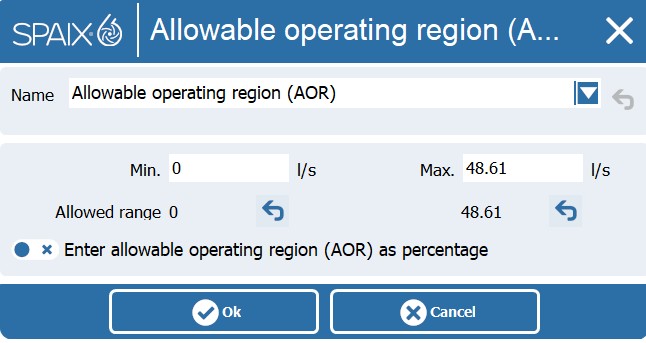
A new name for the range to be created can be entered in the Name combo box.
Under Settings, the new range limits (min. and max.) are entered in the edit fields. The values must not exceed or fall below the previously entered allowed range, which is displayed below. The buttons can be used to reset the entered values to their original state.
|
|
|
This menu contains options for displaying the specified operating points. The menu is also divided into several sections.
The upper section determines how the operating points are displayed.
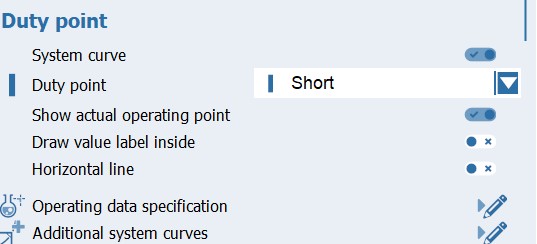
| System curve |
With this option, only the system curves corresponding to the operating points are displayed in the diagram. If the corresponding function is enabled, the actual points are also displayed.
|
Here, you can specify the type of display for the operating points. The following options are available:

|
| Show actual operating point |
This option allows you to display the actual operating points.
|
| Draw values inside: |
This option labels all operating point values for all diagram parts in the diagram.
|
| Horizontal line |
If this option is activated, the operating points are displayed as right angles (triangles) and supplemented by a horizontal line in the Q-H diagram.
|
In the lower area you can specify additional data to be displayed in the chart.
This function can be used to add or remove additional operating points in the Operating Point Data dialog. The functionality is described in the "Operating Data Specification" section.
|
| Additional system characteristics: |
This function opens a dialog in which you can create additional system performance to be displayed.
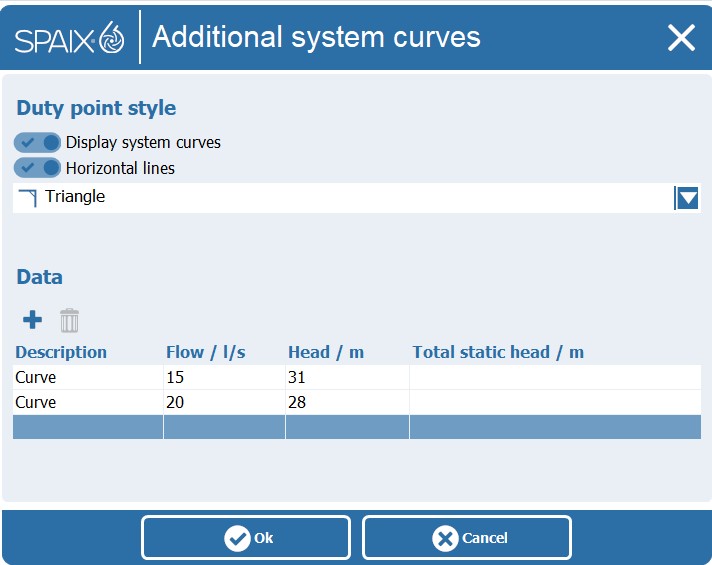
A label must be specified for the curves. A reference point is then specified using the flow rate and head. The geodetic height is then specified.
The options under Operating Point Style are used to select the curve style to be displayed. The menu items correspond to those in the first section of the Operating Point menu described here. However, both menus are independent of each other, allowing different representations of operating point system curves and additional system curves.
|
The Style button displays the currently applied display style for the additional plant characteristics and changes the appearance when the style is changed.
|
|
|
|
This menu refers to the labels of the characteristic curves and the display of the performance curve point data.
| Hints and labels |
In this submenu the position of the information window is defined, which contains the data of the characteristic curve points.
|
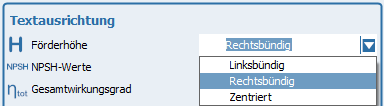
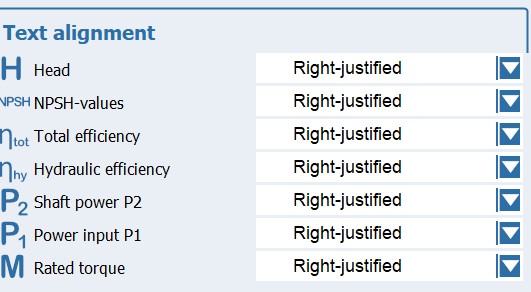
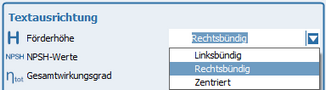
| Alignment of curve labels: |
The settings made in this submenu are only effective if the Show Legend option is enabled. This specifies the positions of the labels for the characteristic curves. This can be configured separately for each section of the diagram to be displayed.
|
|
|
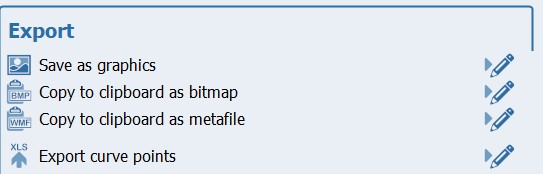
Using this menu, the diagram can be saved as a graphic in a file or copied to the clipboard:
| Save as graphics |
This function opens the Save as Image dialog. Here, you select the target directory and specify the file name. You can choose between *.wmf (Windows Meta File), *.bmp (bitmap), and *.jpg (JPEG) formats.
|
| Copy as bitmap into clipboard |
This function copies the diagram to the clipboard as a pixel graphic in bitmap format (*.bmp).
|
| Copy as metafile into clipboard |
This function copies the diagram to the clipboard as a vector graphic in Windows Meta File (*.wmf) format.
|
| Export curve points |
This option exports the characteristic curve points to an Excel file.
|
|