The operating costs dialog or tab allows you to view the cost trend over a specified period. It also displays the economic efficiency based on energy consumption. To provide this data, an operating point must exist as the basis for such calculations.
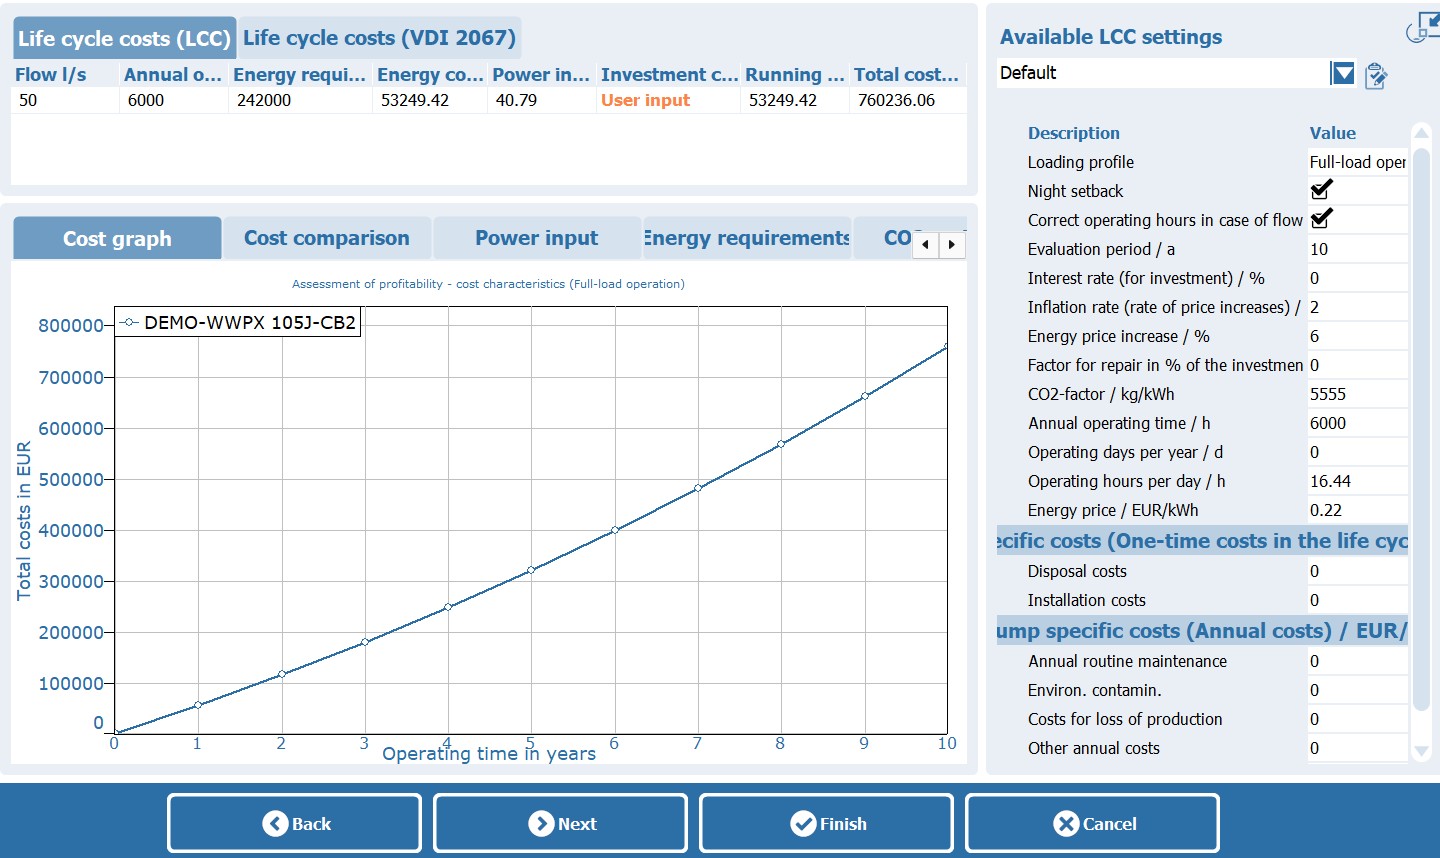
Two analysis models are available: economic efficiency calculation according to the LCC method and economic efficiency calculation according to VDI 2067. These are displayed by selecting the corresponding tabs. Below this is the pump list. Using the checkbox in the first column of the list, you can select the pumps that you want to compare using the diagrams (described below).
The main part of the dialog displays the graphs of the cost and energy diagrams for the selected calculation type. The following tabs are available for this purpose:
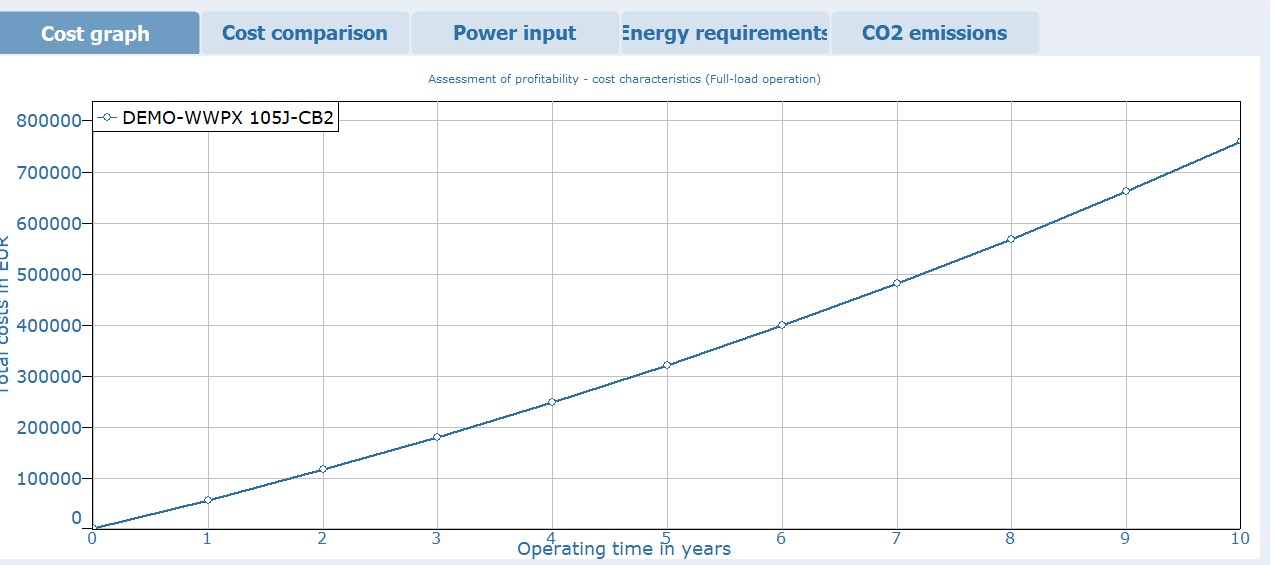
This graph shows the cost increase over the specified observation period. Annual increase rates are taken into account. If multiple pumps are selected, all corresponding curves are displayed.
|
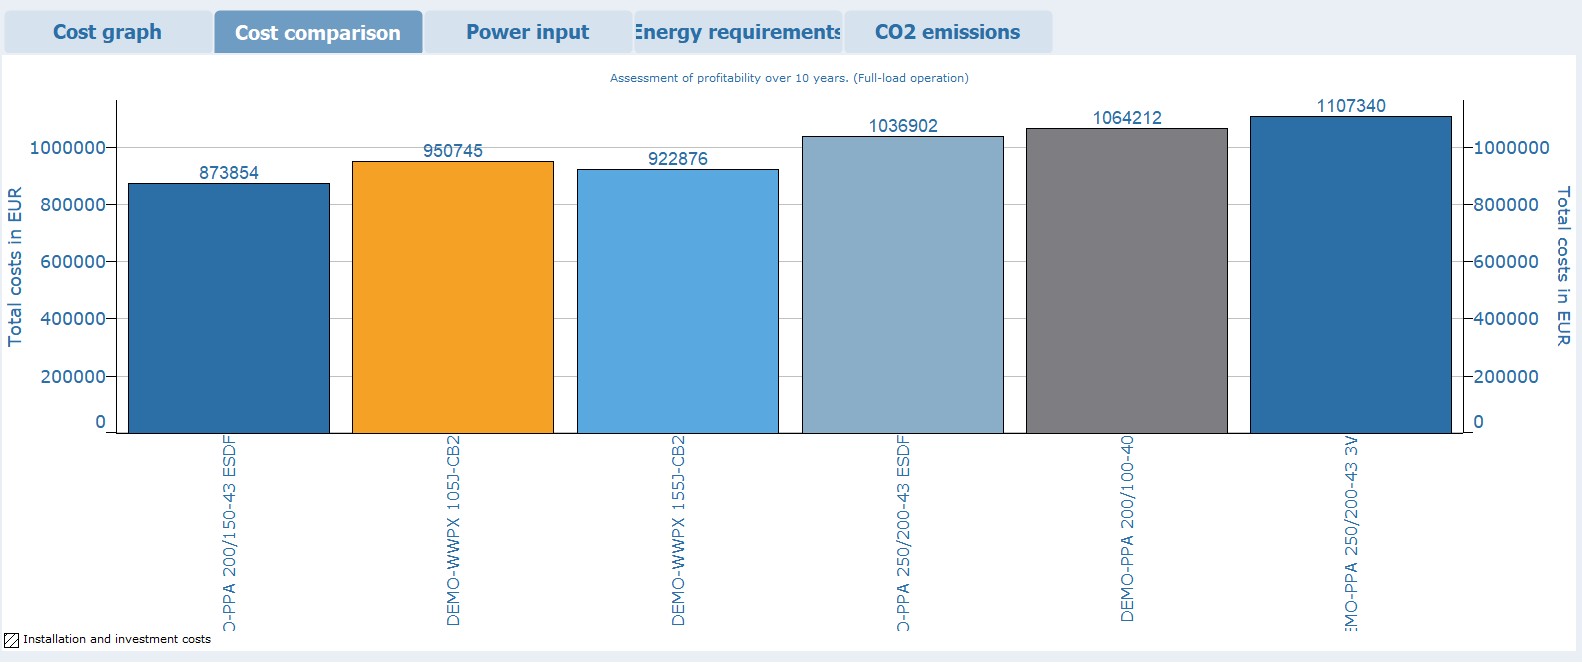
In this tab, an overview of the costs in the defined observation period of the pumps activated in the list is displayed as a bar chart. In addition, information on the savings for the pump with the lowest costs compared to the pump with the highest costs is displayed.
|
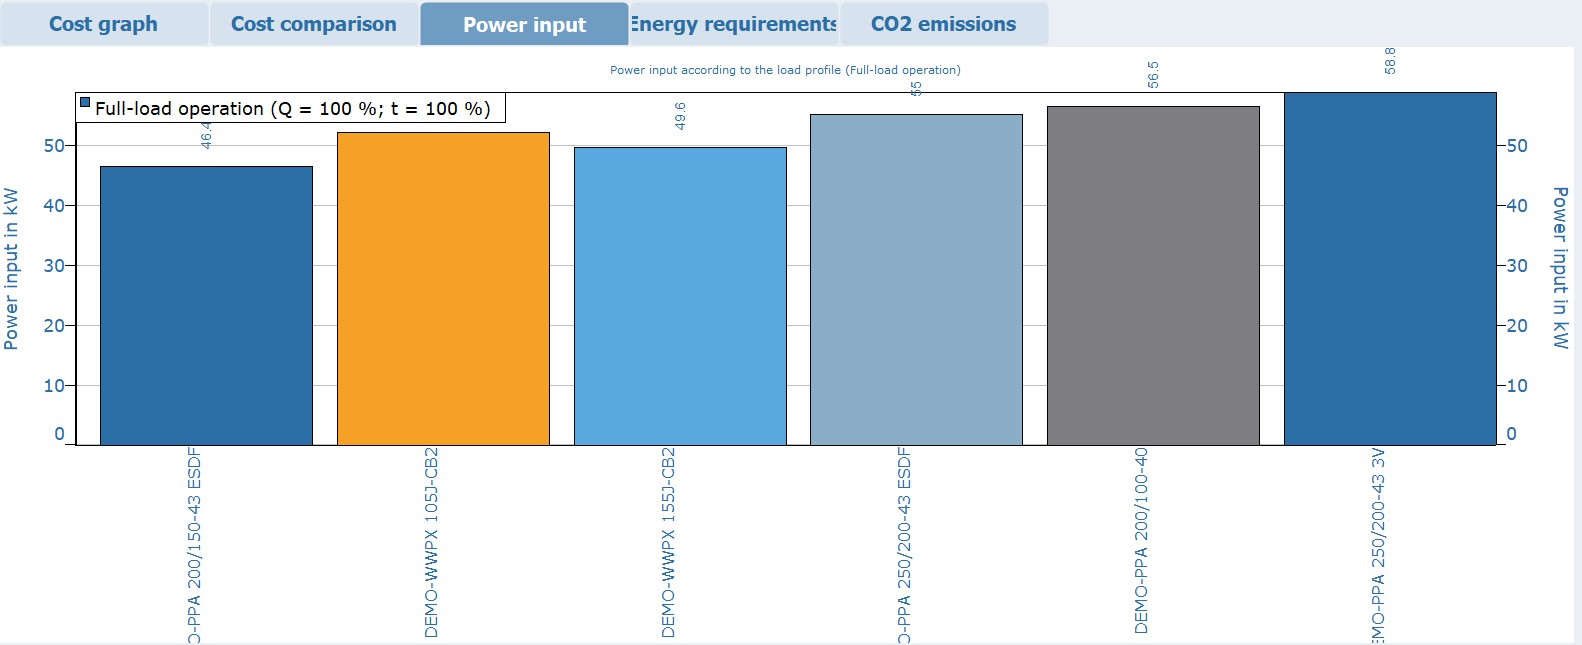
In this diagram, the power consumption values for the individual load profiles are displayed using bars. If several pumps are selected, several bar groups are displayed.
|
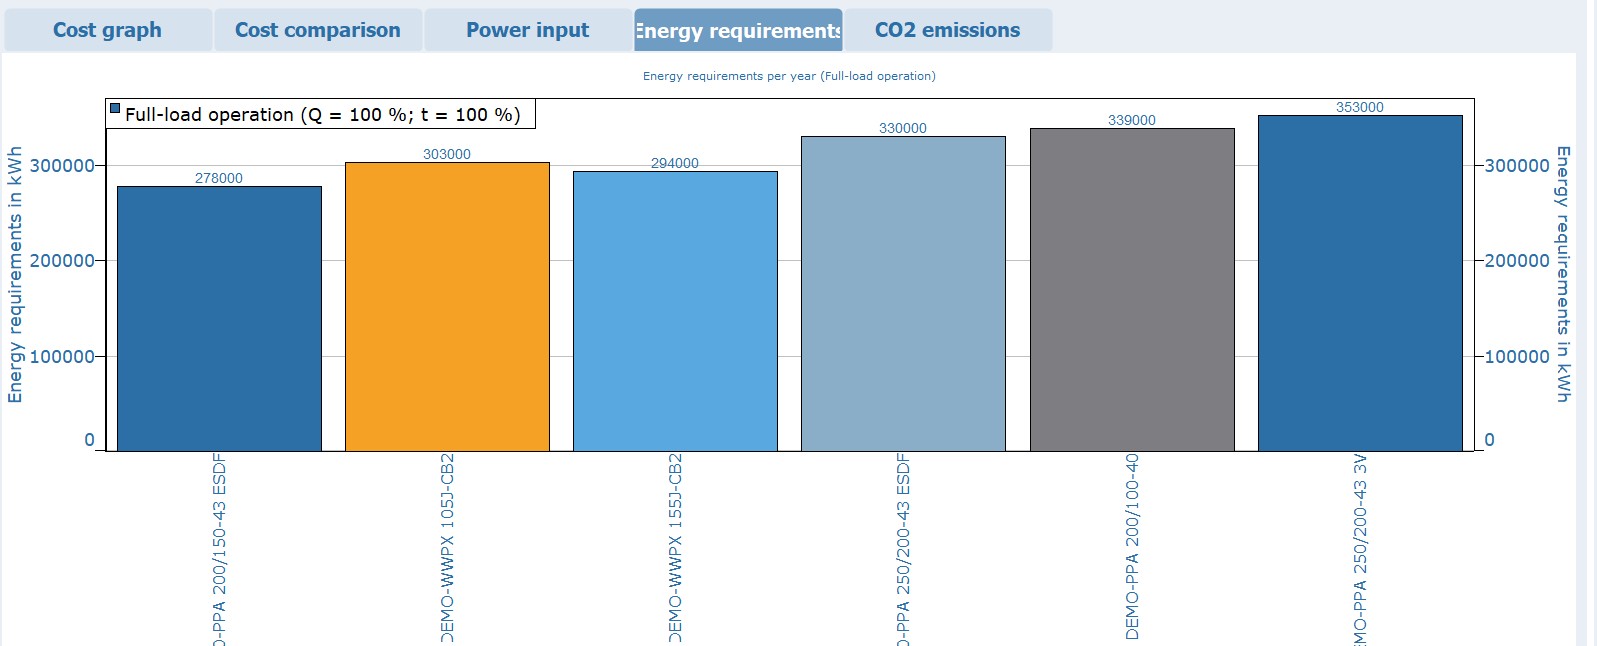
This diagram shows the annual energy requirement, divided according to the load profiles. If several pumps are selected, several bars are displayed next to each other.
|
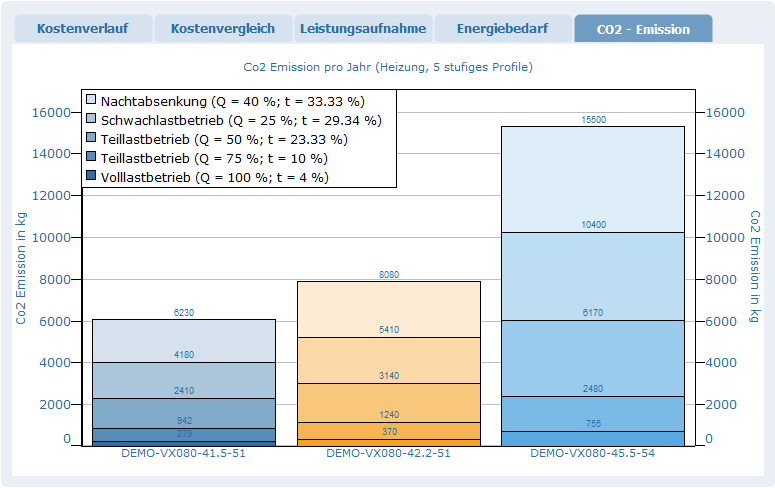
This diagram shows the annual CO2 load in kg, divided according to the load profiles. If several pumps are selected, several bars are displayed next to each other.
|